import numpy as np
import networkx as nx
import matplotlib.pyplot as pltExercise 01
Complex Networks INPE 2025
- read an adjacency matrix from a file
- calculate the number of nodes and edges
- promote different graph’s visualizations
- think about different metrics on the graph
1. Matrix load
Adjacency matrix creation based on numpy methods:
np.random.seed(123)

A = np.random.randint(0, 2, size=(10, 10))
A = np.triu(A, 1)
A = A + A.T
Now the graph can be created, based on matrix A:
G = nx.from_numpy_array(A)2. Nodes and edges
Counting nodes and edges:
print(f'Nodes: {len(G.nodes)}')
print(f'Edges: {len(G.edges)}')
Nodes: 10
Edges: 173. Visualization
Using matplotlib and nx.draw:
plt.figure(figsize=(8, 5), dpi=300)
nx.draw(
    G,
    with_labels=True,
    node_color='lightblue',
    edge_color='grey',
    node_size=1000,
    font_size=10,
)

plt.show()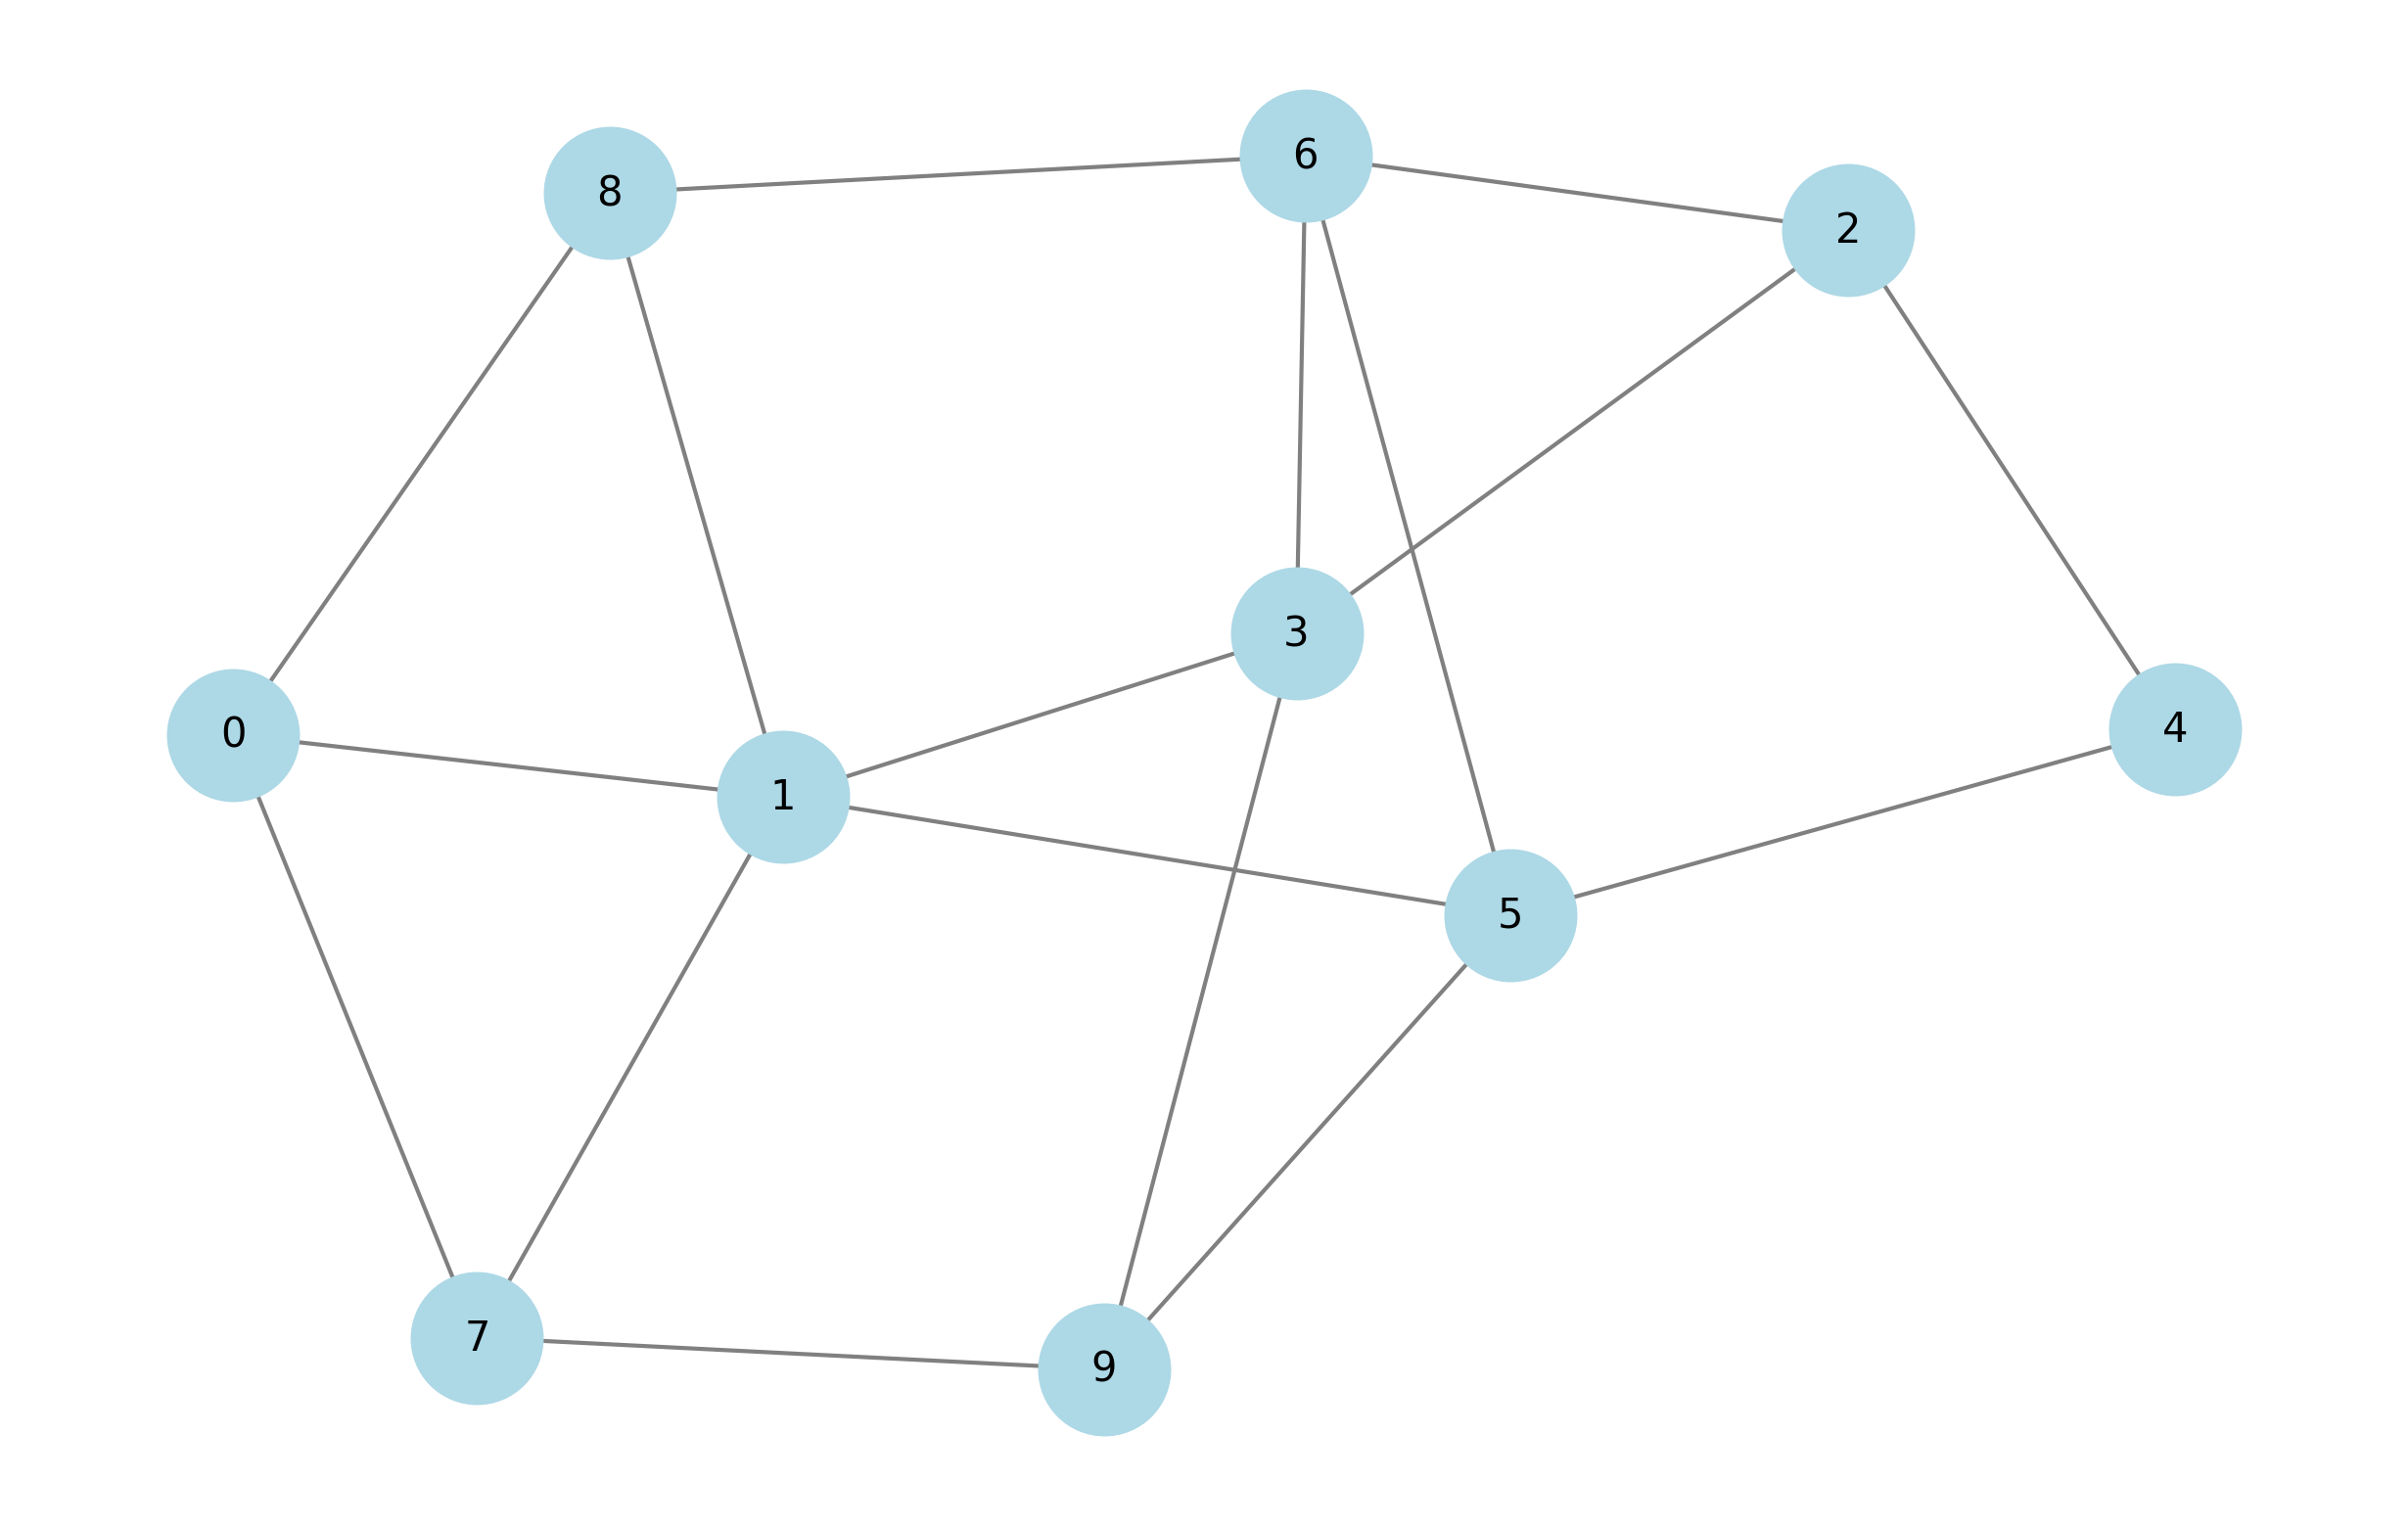
4. Metrics
4.1 Global metrics
Average shortest path length:
print(nx.average_shortest_path_length(G))1.77777777777777774.2 Node metrics
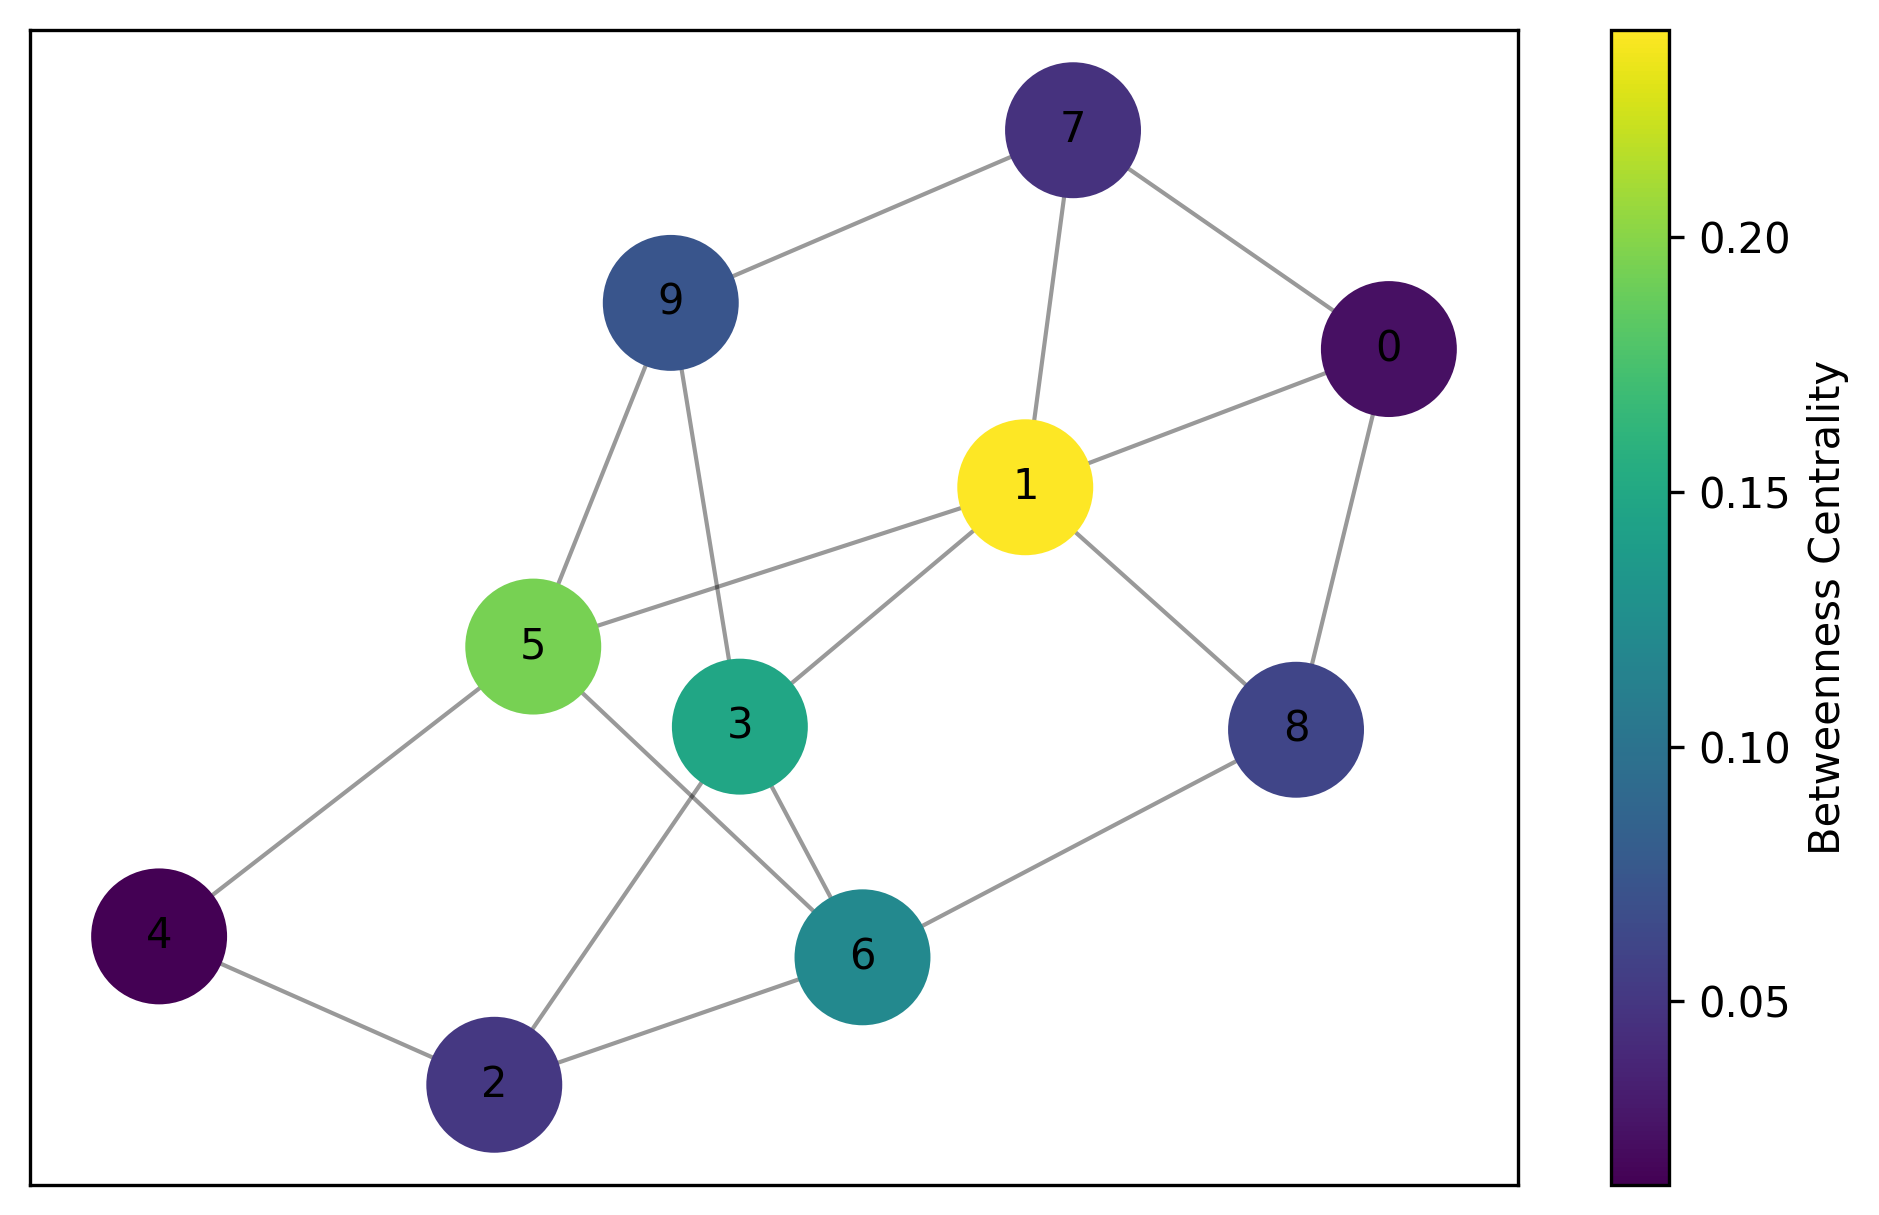
Betweenness:
betweenness = nx.betweenness_centrality(G)
plt.figure(figsize=(8, 5), dpi=300)
pos = nx.spring_layout(G, seed=42)
nodes = nx.draw_networkx_nodes(
    G,
    pos,
    node_color=list(betweenness.values()),
    node_size=1000
)
edges = nx.draw_networkx_edges(G, pos, alpha=0.4)
labels = nx.draw_networkx_labels(G, pos, font_size=10)
plt.colorbar(nodes, label="Betweenness Centrality")